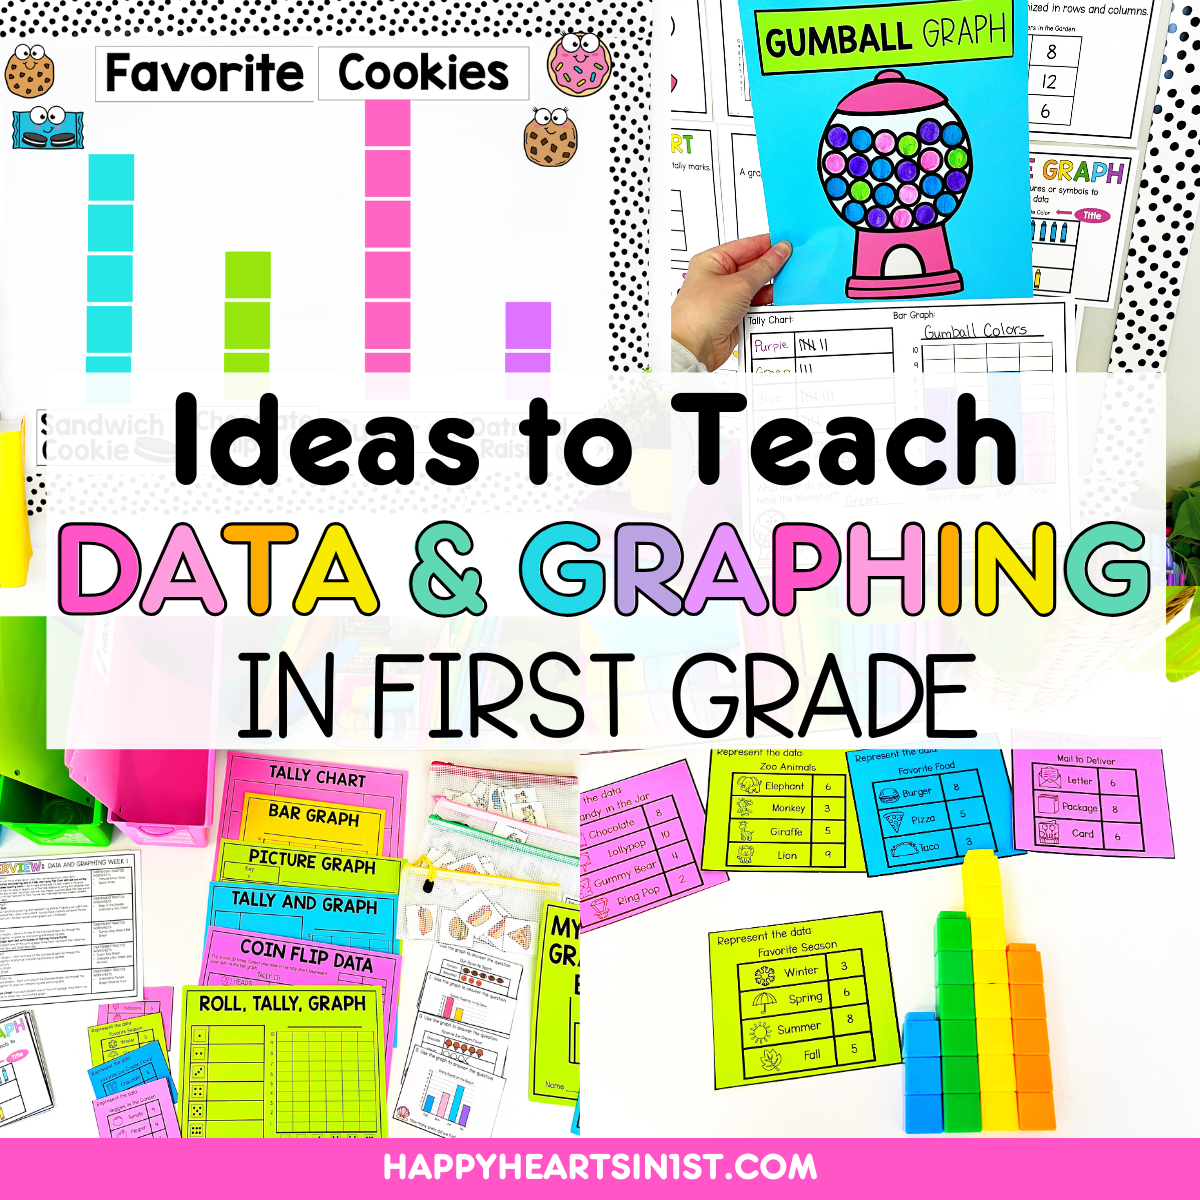
Data and graphing is one of my favorite math units in 1st grade! It’s exciting to see students take ownership of their learning as they collect data, organize it into graphs, and analyze what they discover. Whether it’s tally charts, bar graphs, or picture graphs, this unit helps build critical thinking and problem-solving skills in a meaningful way.
In this post, I’m sharing my favorite hands-on data and graphing activities that make learning fun and engaging. From interactive mini-lessons to small group activities and independent practice, these ideas will help your students master data collection and interpretation.
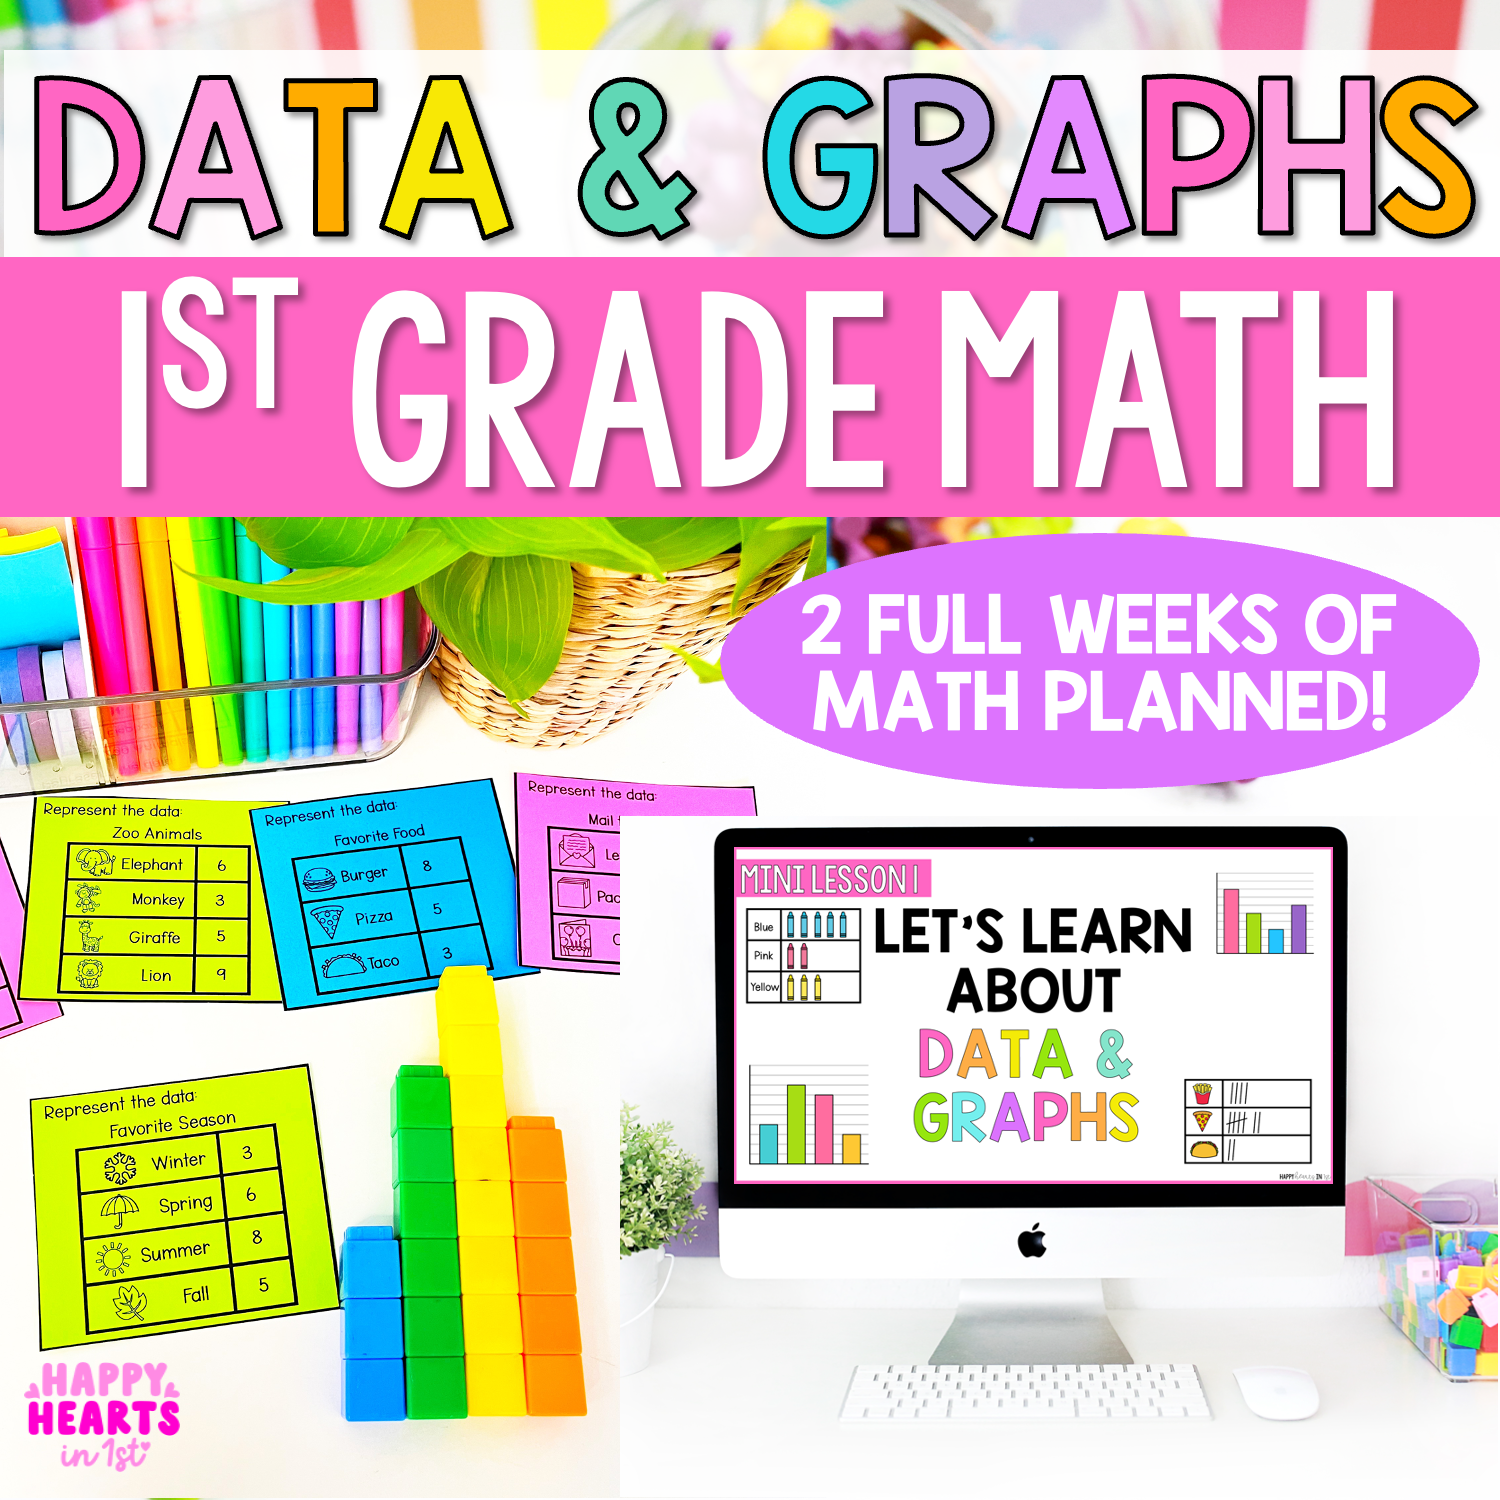
Want your data and graphs unit planned for you? Check out my Happy Math Unit for lesson slides, small group activities, math centers, and more!
Data and Graphing Mini Lessons
Interactive slides are my favorite way to introduce new math concepts! I love that they are large enough for all to see. I always have my students sit next to a math partner for turn and talks to share thinking during the lessons.
Students bring a dry erase board and marker so that everyone can be actively engaged during quick practice in the mini lesson!
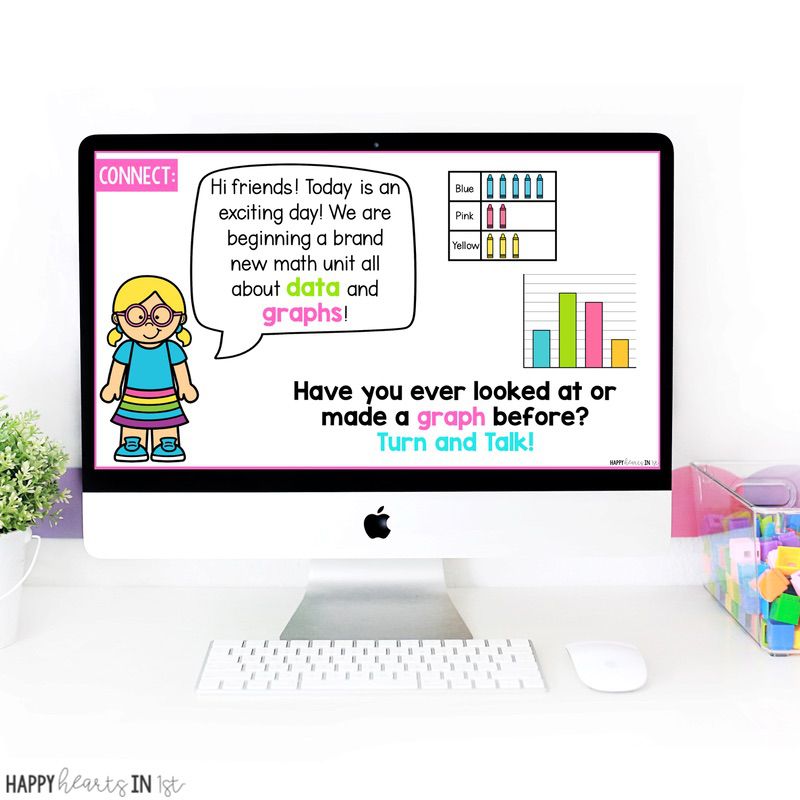
These slides make it easy to prep lessons that are engaging for all students! Each lesson has:
- Our daily learning objective
- Math Vocabulary
- Direct Instruction and Modeling
- A quick practice activity
- Critical Thinking/ Discussion
Hands-On Data and Graphs Activities for Small Groups
After our whole group mini lesson, students begin their daily 3 Guided Math Rotations. During this time, I meet with small groups of students at my teacher table. This is when students receive differentiated instruction from me while practicing their data and graphing skills in hands-on ways! Here are some of my favorite hands-on data and graphing activities!
Use Cubes to Make Physical Bar Graphs
Instead of just drawing bar graphs on paper, students can build them using linking cubes! Each student in the group gathers data (such as favorite colors or types of pets), and then they stack cubes to represent the responses. This hands-on method helps students visualize and compare data in a concrete way before transferring their learning to paper graphs.
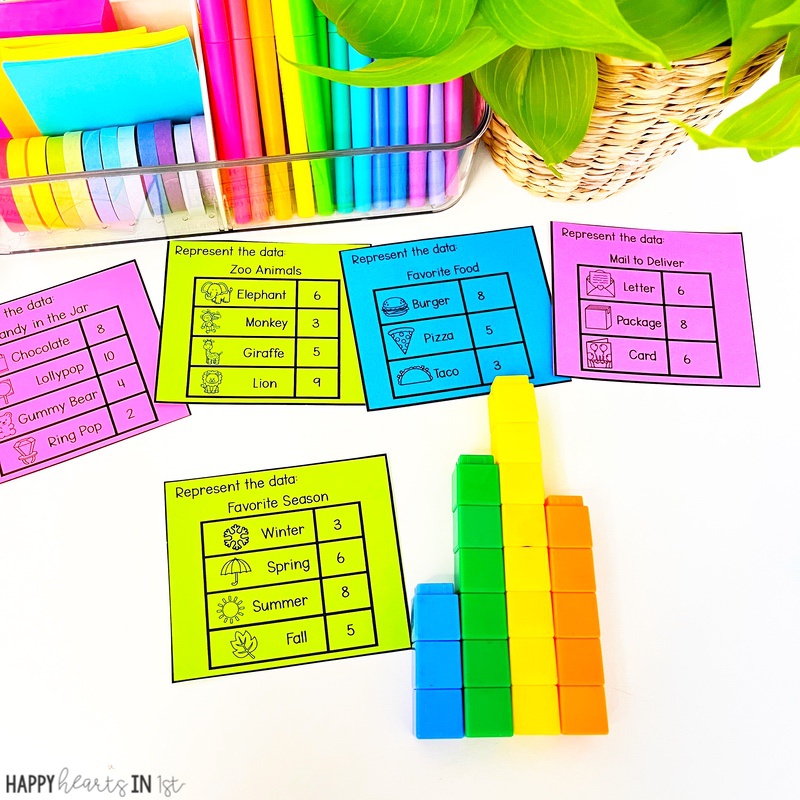
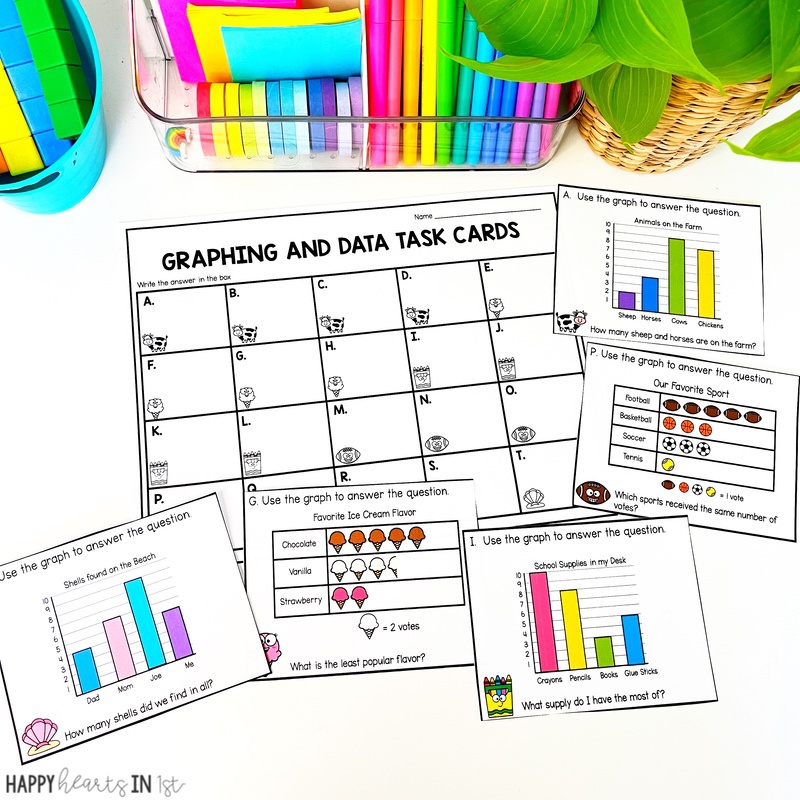
Data and Graphing Task Cards
Data Task Cards are a fun way for students to practice representing and interpreting data. With visual supports, they’re perfect for math centers or small groups! I use these with so many different small group activities and centers!
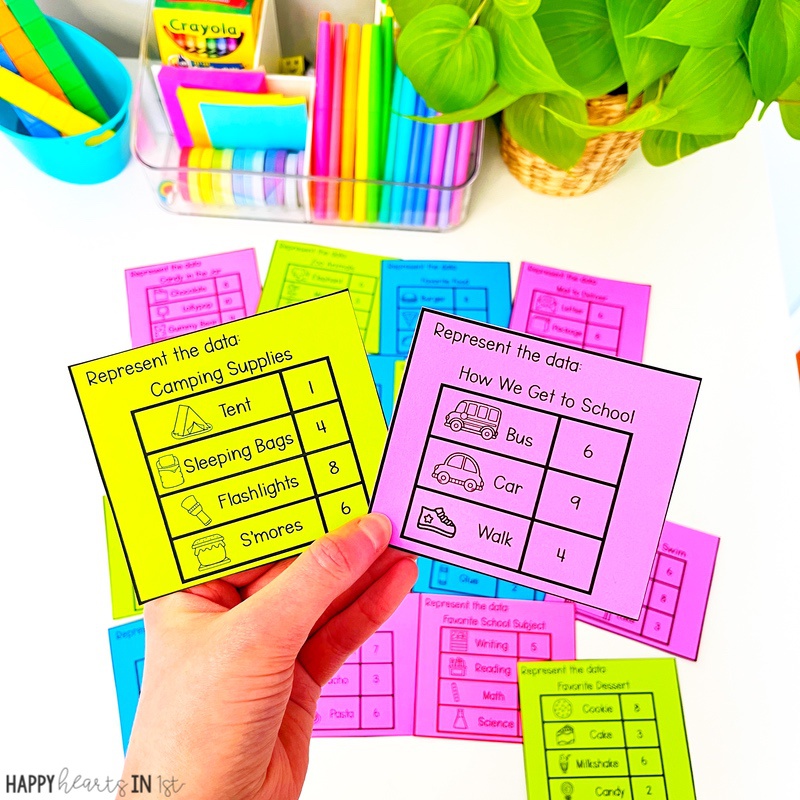
How to Use:
1️⃣ Model It – Read a card aloud, write the categories, and demonstrate how to record the data in a tally chart or graph.
2️⃣ Discuss the Data – Ask questions like, “Which has the most? The least?” and encourage students to come up with their own.
3️⃣ Student Practice – Assign each student or pair a card to complete on their own.
This simple, hands-on activity helps students build confidence in working with data!
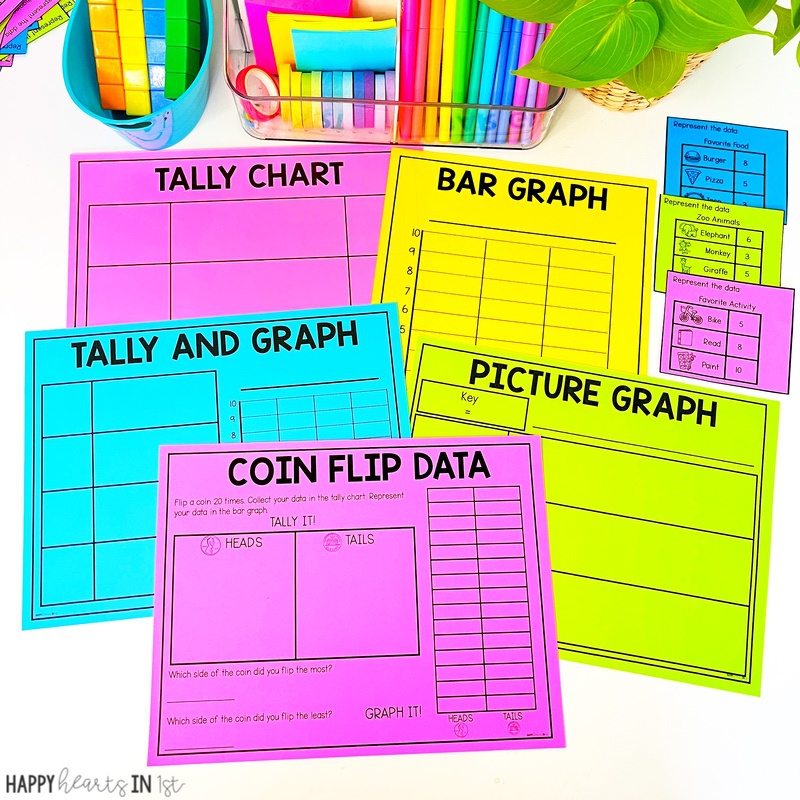
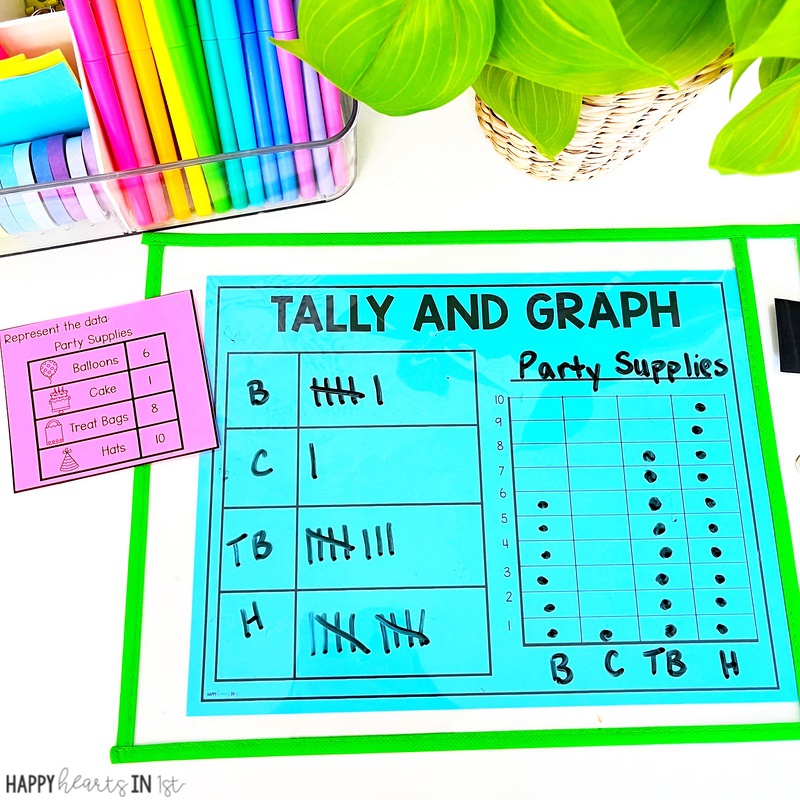
Tally and Graph: Creating Tally Charts and Bar Graphs to Represent Data
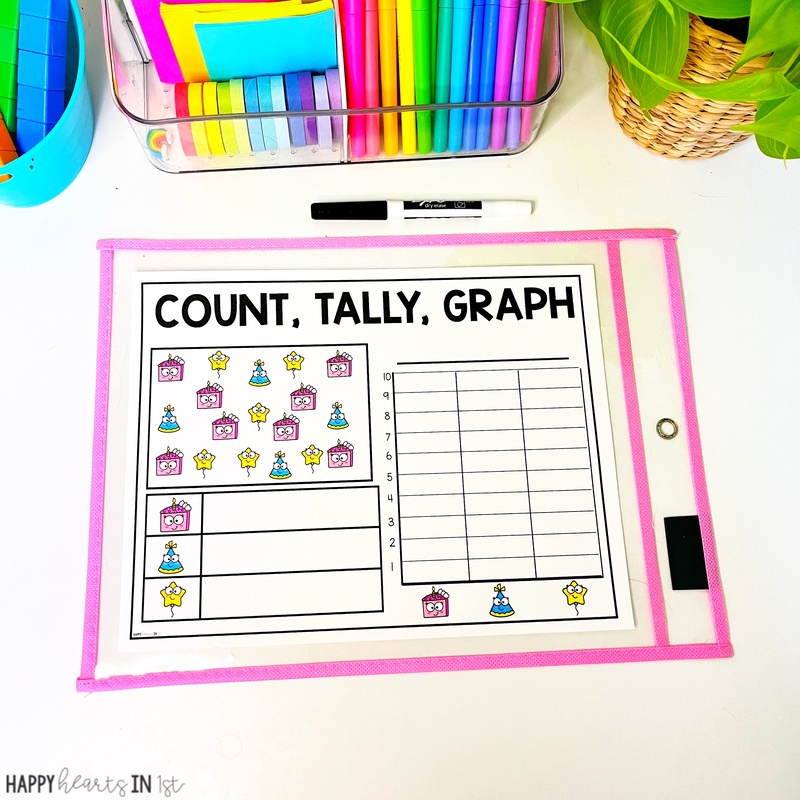
One of my favorite tools to use in small groups are math mats! To use, just slide into a dry erase pouch and add manipulatives! For our Tally and Graph mat mat, students practice representing data in 2 different ways- a tally chart and a bar graph. Then we practice asking and answering questions to interpret our data!
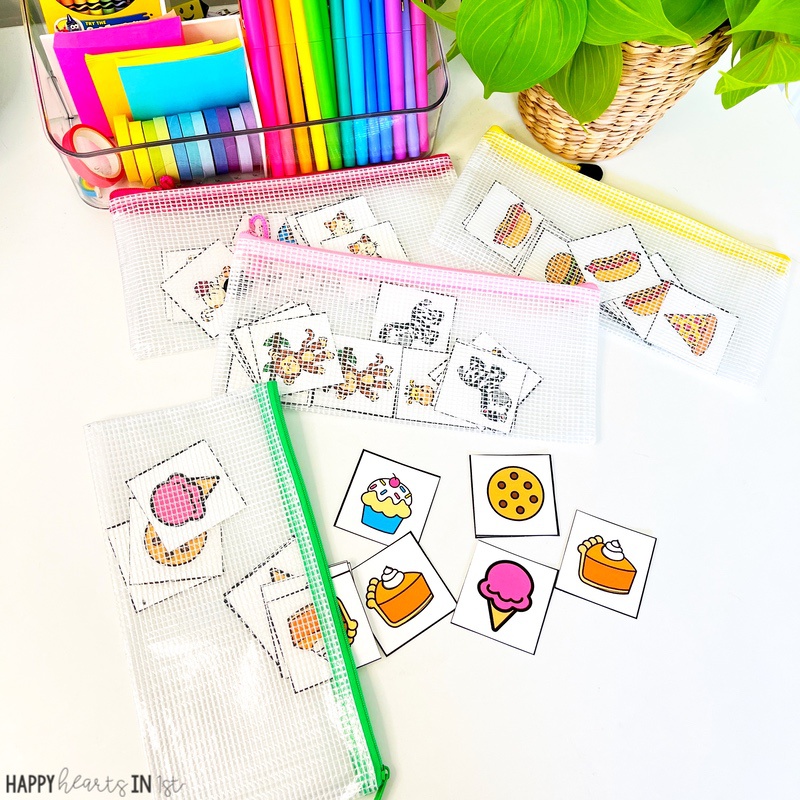
Data Bags in 1st Grade
A fun way to practice data collection is by using “data bags!” Each small group gets a bag filled with a mix of objects—such as different colored counters, small toys, or shape cutouts. Students sort the items into categories, record the data, and create a graph to represent their findings. This hands-on activity reinforces sorting, counting, and graphing in a playful and engaging way. It’s also great for introducing picture graphs in 1st grade!
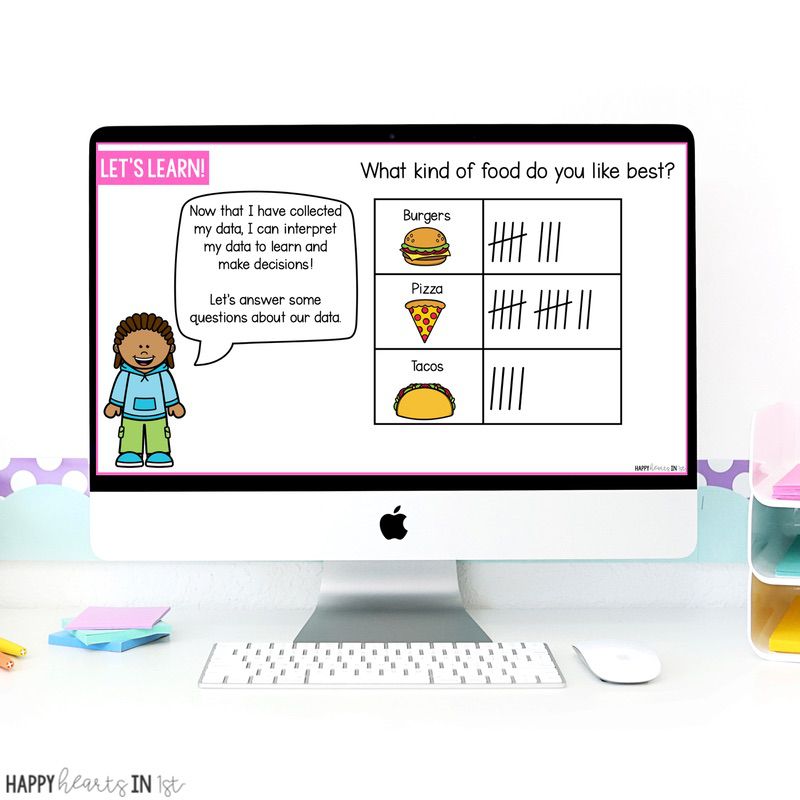
Interpreting Data in 1st Grade
We spend a lot of time is our whole group lessons and our small group time asking and answering questions about our data. Interpreting data is an important skill that needs to practiced over and over!
I guide students in analyzing their data by asking questions like:
- Which category has the most?
- Which category has the least?
- How many more are in this category than another?
- What conclusions can we draw from this data?
One way we practice is by looking at example graphs and answering discussion questions.
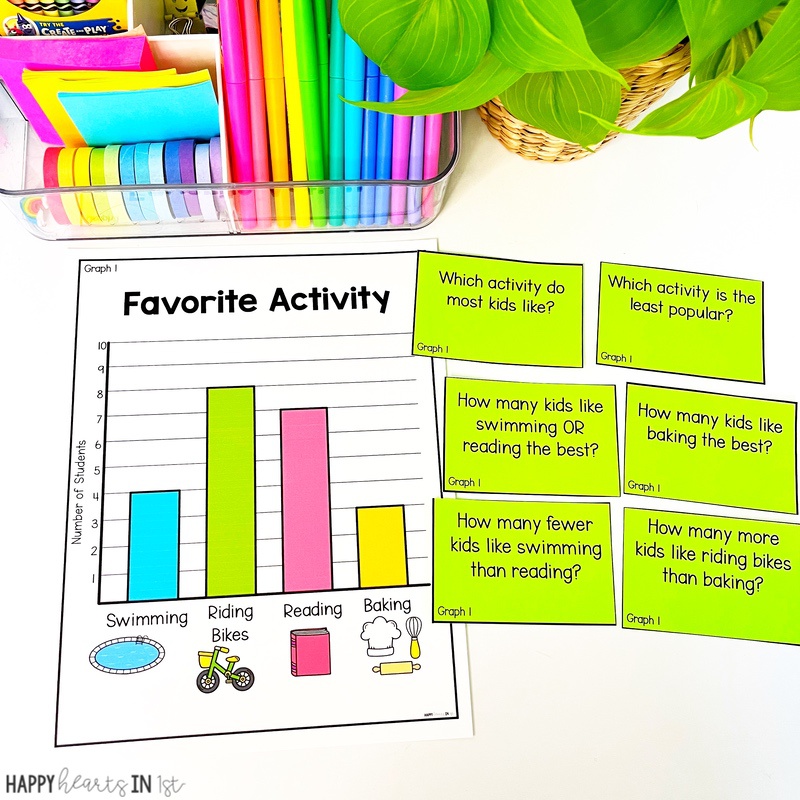
Students can also practice independently with these data and graphing task cards!
Using these interactive, small group activities, students not only learn how to organize and represent data but also develop the critical thinking skills needed to analyze and make sense of the information they collect. These activities make learning hands-on, engaging, and meaningful for all learners!
Data and Graphing Math Centers
In my data and graphing unit, I included tons of activities that students can complete independently to practice their data and graphing skills! These can be done in small groups or as independent math centers. Here are a a few favorites:
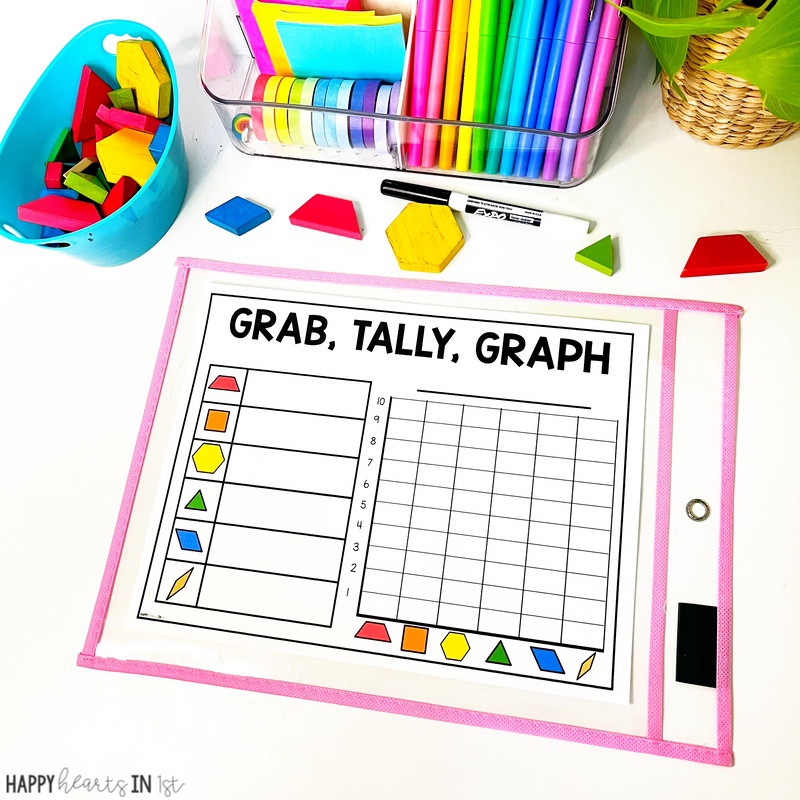
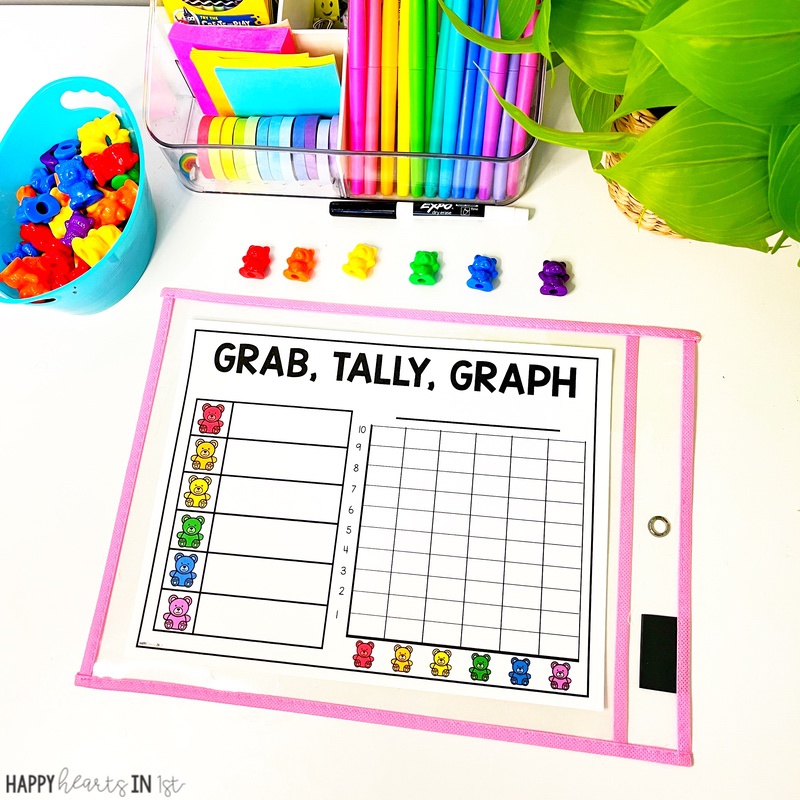
Grab, Tally, Graph
- Put a few buckets of pattern blocks or counting bears on your small group table. Students will reach in and grab a handful. (or use scoops for more manipulatives)
- They will sort the objects and represent the data in a tally and bar graph.
- After representing data, ask students questions or have them come up with questions to ask to interpret the data.
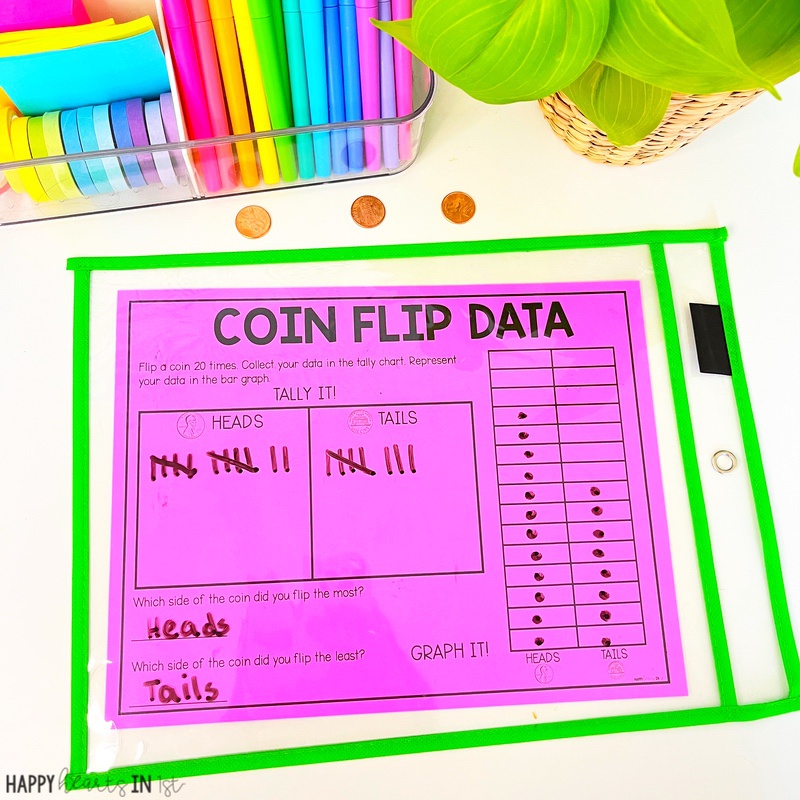
Coin Flip Data
Students will flip a coin and make a tally mark to show heads or tails. After flipping the coin 20 times, they can record their data in the bar graph.
Count/Spin/Color, Tally, Graph
Students will count the number of each object and represent the data in a tally chart or bar graph. After representing data, ask students questions or have them come up with questions to ask to interpret the data.
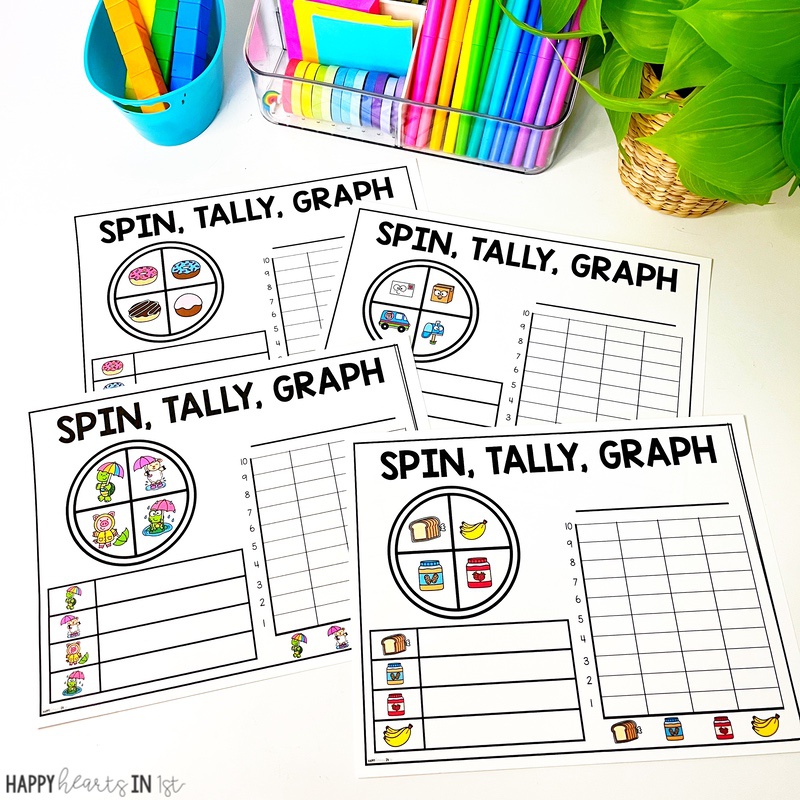
In this activity, students spin the spinner and represent their data in the tally chart and bar graph!
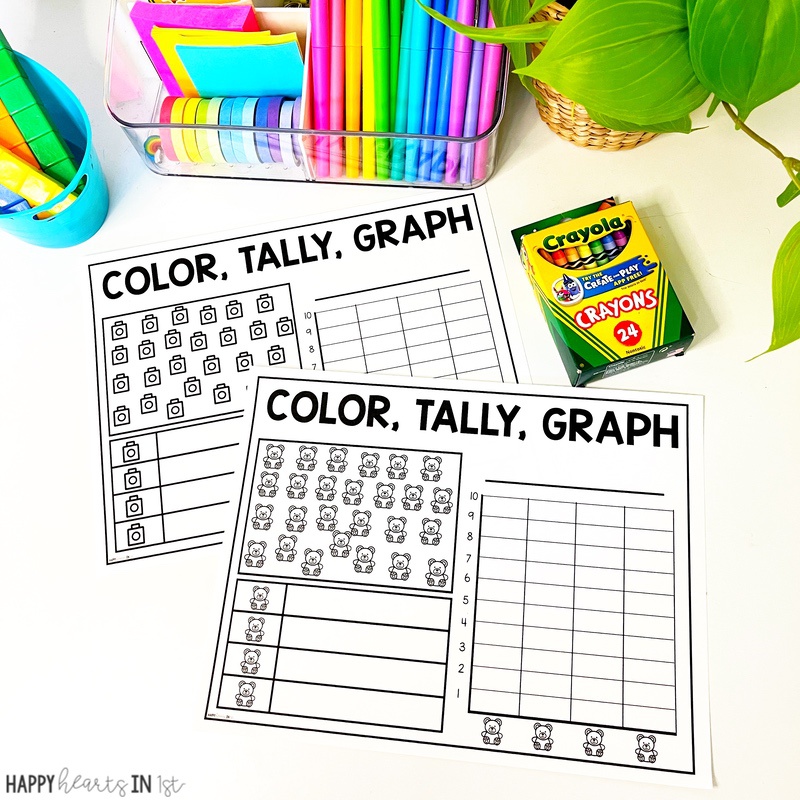
Finally, students use 3-4 crayon colors and color the data set any way they choose. Then they will record the data in the tally chart and bar graph!
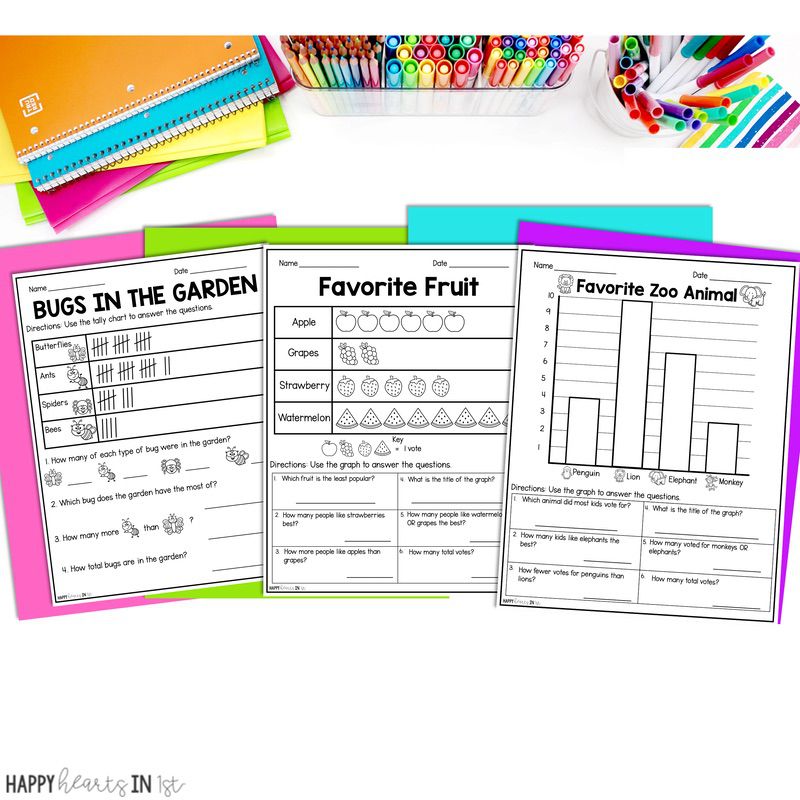
1st Grade Graphing Worksheets for Independent Practice
After hands-on learning in small groups, students need opportunities to independently apply their data and graphing skills. This is where graphing worksheets come in! These activities provide structured practice for students to represent and interpret data on their own.
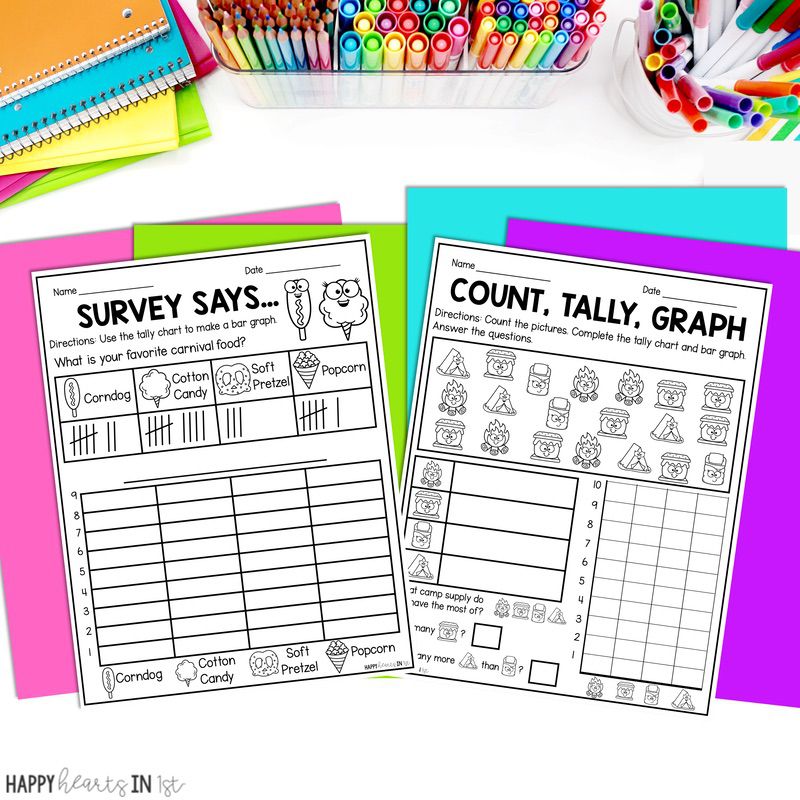
These worksheets are great for morning work, independent math rotations, early finisher activities, or homework. They help build confidence in data collection, graphing, and analysis while allowing students to work at their own pace.
Creating Class Graphs
Class graphs are a fun and engaging way to help students connect math to their own experiences while working together as a class! These whole-group activities allow students to collect real data, organize it, and analyze the results in a meaningful way.
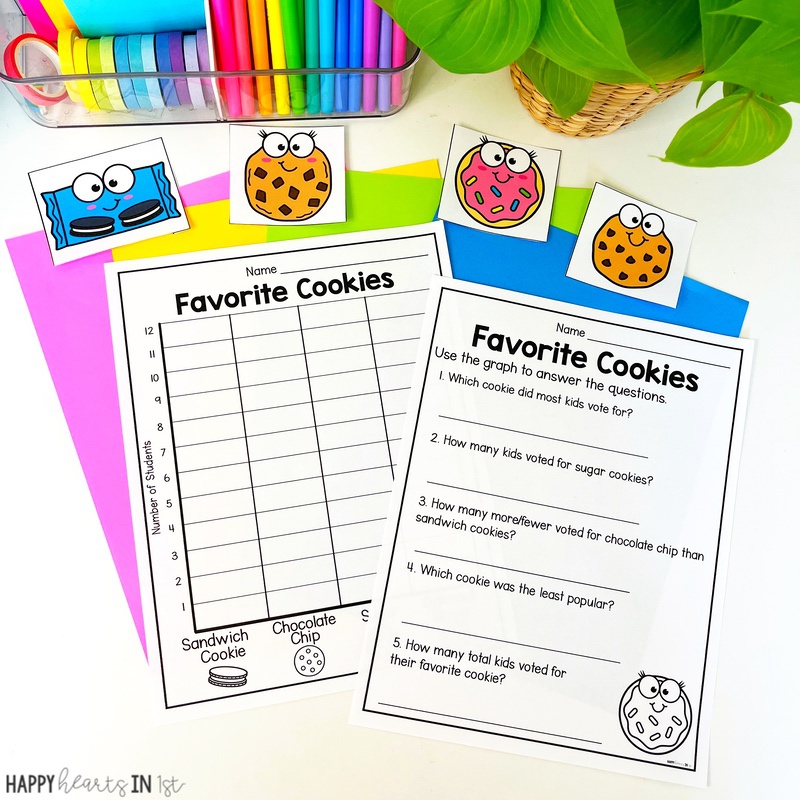
Favorite Cookie Graph 🍪
Who doesn’t love cookies? In this activity, students vote for their favorite cookie (chocolate chip, sugar, or oatmeal, for example). We collect our votes as a class and create a large visual graph on chart paper.
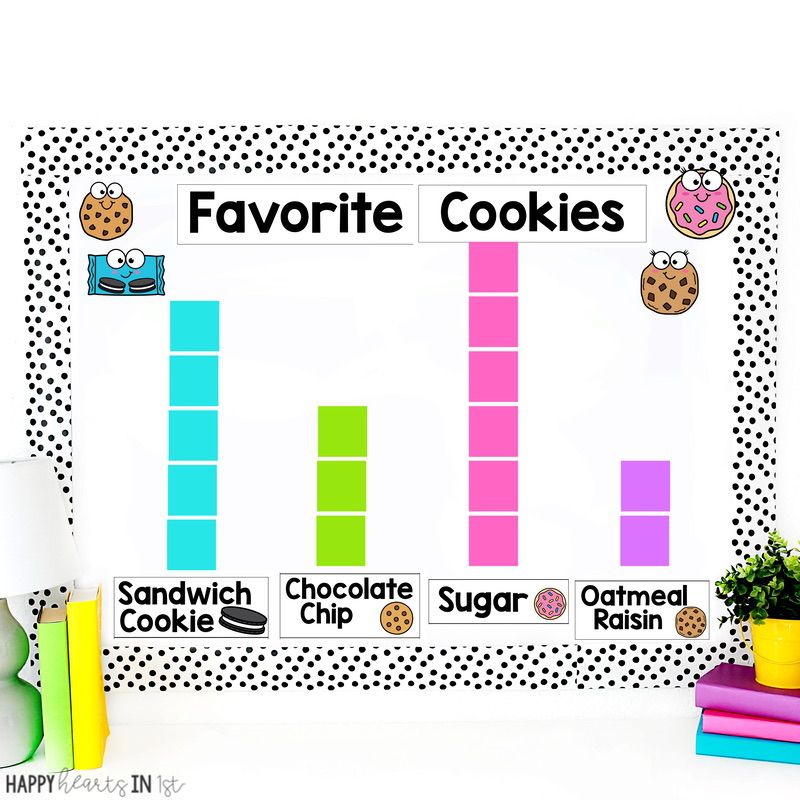
Then, we work together to analyze the data by asking questions like:
- Which cookie was the most popular?
- How many more students liked chocolate chip than oreo?
- How many total votes?
Data and Graphing Projects
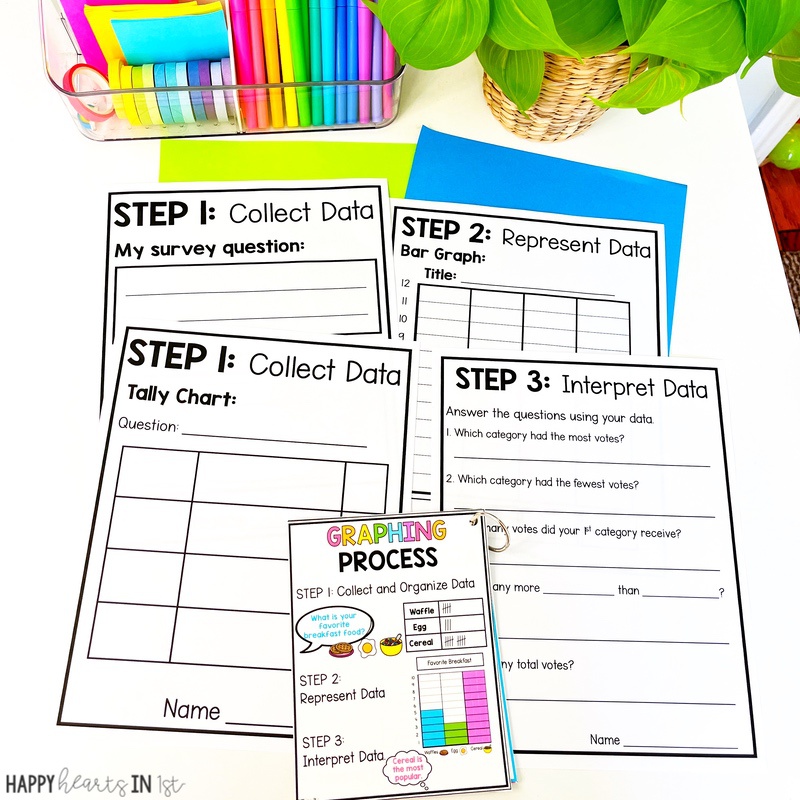
To wrap up our Data and Graphing Unit, students complete a hands-on Graphing Project that allows them to apply all the skills they’ve learned in a meaningful and engaging way! This project walks students through the entire graphing process, from choosing a survey question to collecting, organizing, and interpreting their own data.
I love using this project as a culminating activity because it gives students the opportunity to take ownership of their learning and see how graphing is used in the real world.
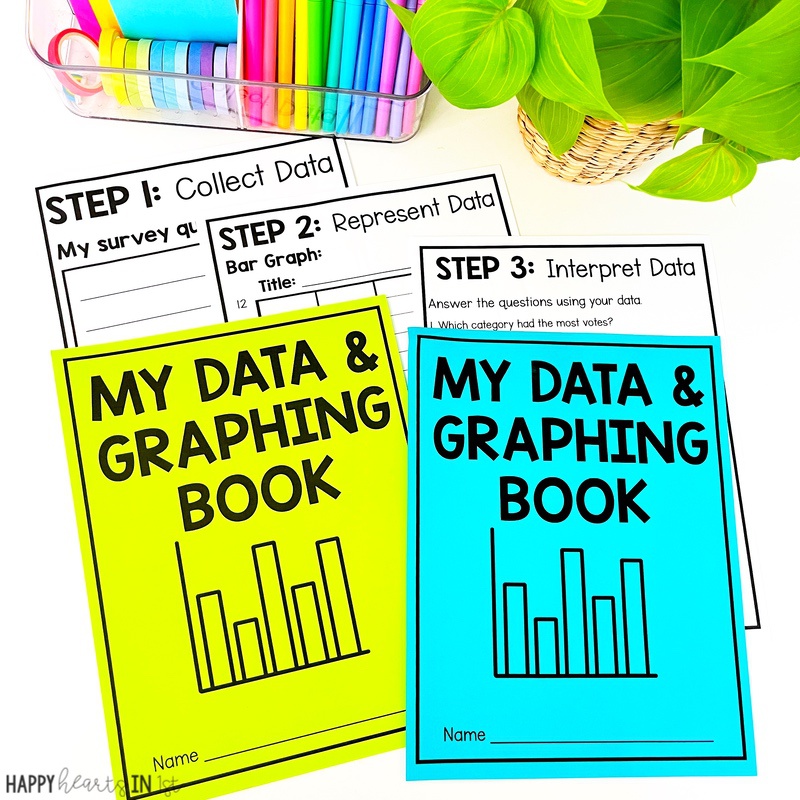
Here’s a breakdown of how I structure it over three days:
Day 1: Choose a Survey Question & Categories
Students select a survey question (e.g., favorite fruit or recess activity) and decide on categories. Encourage them to choose questions that will interest their classmates.
Day 2: Survey Classmates & Record Data
Students ask their question, tally responses, and track who they’ve surveyed with an editable checklist. This helps students practice data collection and organization.
Day 3: Create a Bar Graph & Interpret Data
Students use their tally chart to create a bar graph and answer questions about the data, such as “Which category had the most votes?” This reinforces skills in graphing and data interpretation.
This project brings graphing to life in a way that is both structured and student-driven. It’s the perfect way to reinforce data collection, organization, and interpretation while giving students a sense of accomplishment as they see their surveys turn into real graphs!
By the end of the project, students truly understand the power of data—and they have so much fun in the process! 🎉
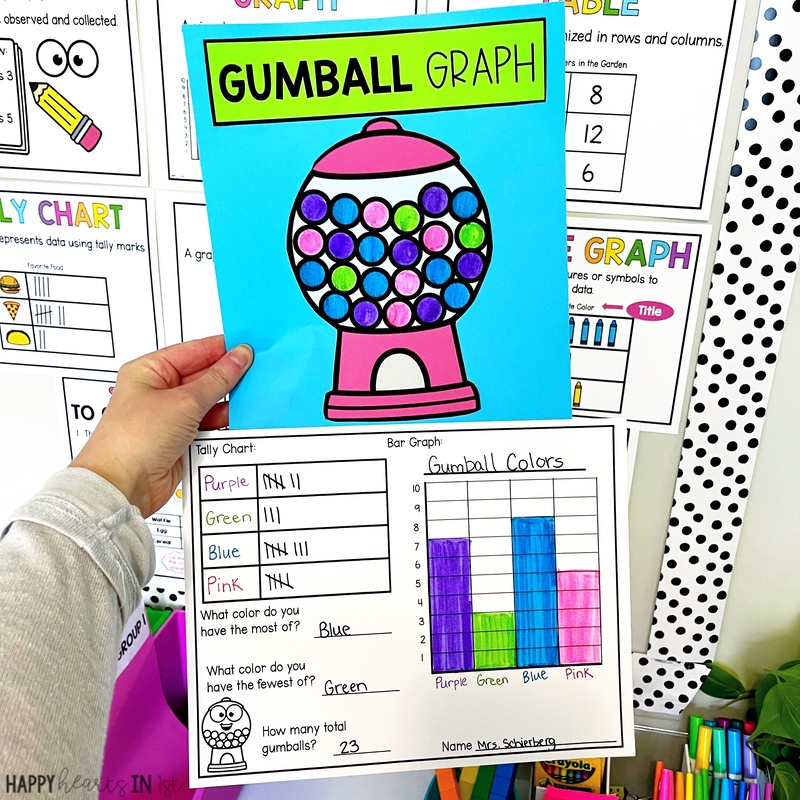
Bubblegum Data and Graphing Math Craft
Wrap up and celebrate your data and graphing unit with this engaging and creative math craft! Students will apply their graphing skills in a fun, hands-on way while making their own Bubblegum Graph.
Data and Graphing in 1st Grade
Teaching data and graphing in 1st grade is so much fun when students have hands-on opportunities to collect, organize, and interpret information!
If you’re looking for a done-for-you resource to make planning easy, be sure to check out my Data and Graphing Unit. With lesson slides, centers, worksheets, and projects, everything is ready to go so you can focus on teaching! Find it here!